Save Up To 20% On Chromix’s ColorThink Software
They say “A picture is worth a thousand words.” In some cases, it’s worth far more. That’s certainly true of the images generated by CHROMiX’s ColorThink. The folks at CHROMiX say, “You can’t manage your color if you don’t understand it. Nothing gets the idea across faster than the graph of a printer gamut.” They’re right.
CHROMiX ColorThink is the award-winning color management toolset that helps you understand your color more than ever before, primarily (but not exclusively) by graphing it. The ColorThink toolset is an application for managing, repairing, evaluating and graphing ICC profiles, composed of nine modules that are proven to “keep your brain on color”.
Profile Manager
Organize your profiles individually or in sets
Profile Inspector
Open all types of ICC Profiles and inspect their color data and other details. Change default settings to fit your workflow. Display neutral rendering curves.
2D Graphing
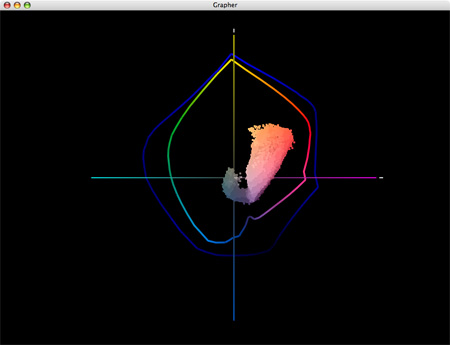
2D graphing gives you both general and specific views, allowing the overlay of multiple profiles and data sets.
3D Graphing
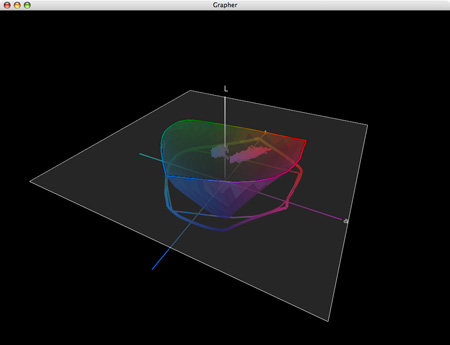
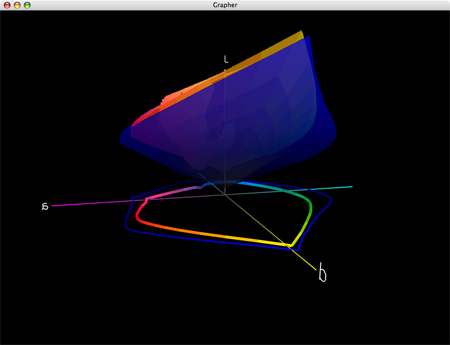
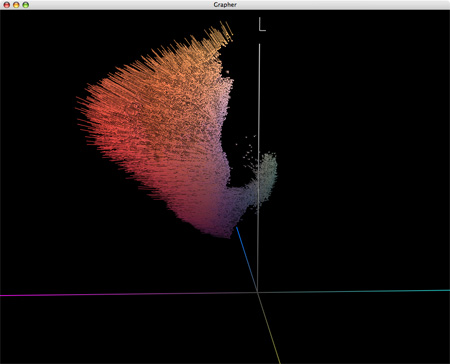
3D graphing gives you the whole picture. Analyze your devices and workflow. See the cause of proofing and printing problems. Graph measurement files and image colors to compare with device gamuts.
Image Inspector
Open images and see the embedded profile. Export, change(mac only) or delete(mac only) it at will. Learn to handle the files your customers are sending.
Profile Renamer
Profiles have two names; internal and external. Confused by what appears in menus? Change the internal and external names with this tool.
Profile Linker
Some RIPs allow linked profiles to be loaded for proofing purposes. Profile Linker will build those profiles for you, quickly and easily.
Profile Medic
Multi-point integrity checks can be performed on one or all the profiles in your system. If Profile Medic finds fixable problems with a single click it will get you back to work.
Color Lists
Open measurement files from most profiling applications. View them in list form with rendered colors. Apply profiles to the lists for testing and graphing.
ColorThink is a very robust color management software. Only a few advanced users will use its full toolset. But almost everyone can benefit from using a few of its most essential features.
For me, graphing color is the core utility of this tool. Graphs are useful abstractions. When you’re dealing with a lot of information, graphs can condense and focus information from specific perspectives revealing useful information. This is certainly true of color. Because color has three dimensions (luminosity, hue, and saturation), graphs of color in 2D always leave something out, while graphs of color in 3D give you a more complete picture and more useful perspectives.
ColorThink gives you powerful tools for graphing color in both 2D and 3D. You can graph ICC profiles (input, display, output), color, color lists, or images. You can graph multiple profiles simultaneously for comparison. You can graph profiles and images simultaneously for comparison. You can view graphs in multiple formats such as shaded objects, wireframes, points, and vectors. You can change color and transparency to make comparison easier. And you can rotate, pan, and zoom your viewpoint dynamically.
Every time I lecture on color, I use ColorThink. Every time I evaluate a new inkset or substrate or printing profile, I use ColorThink. While I don’t graph every image before I print it, I do graph particularly challenging images to print and ColorThink always reveals useful information. I recommend it highly.
This utility not only expanded my understanding of color and color management but it has also helped me refine an advanced perspective on color theory (the conceptual tools artist’s often use to help structure color palettes and make color choices). It’s my hope that in the 21st-century 2D color wheels (such as Leonardo’s, Goethe’s, and Itten’s) will be replaced with 3D color volumes.
2 A 2D graph (two profiles and an image) tells only part of the story. The gamut of semi-gloss papers seem moderately extended when compared to matte papers; the image appears in gamut for both.
3 A 3D graph of two profiles tells you more. Semi-gloss papers have greatly extended dmax and gamut in dark values but reduced gamut in lighter hues; warm highlights are out of gamut for both (better highlight saturation is found in matte) and cool shadows are out of gamut for matte.
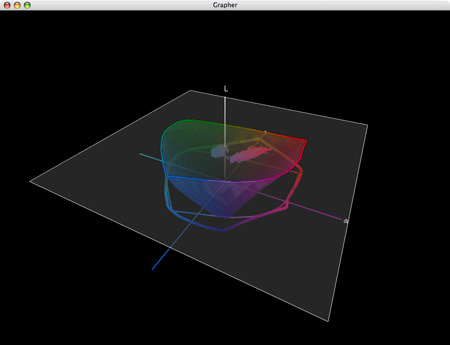
4 Gamut can be sliced at specific luminosity values.
5 Display the effects of profiles on colors in images with vectors.
Visit the ColorThink product pages at www.chromix.com to learn more.
Read more on Color Management here.
Learn more in my digital photography and digital printing workshops.


